Transactional Job Queues and the Two Generals’ Problem
Our worst outage in a decade of running Hypothesis, and how we made sure it never happened again.
This is the blog post version of a presentation that I gave at the PostgreSQL Edinburgh Meetup in February 2026. Here’s the original PDF slides.
Hypothesis
Hypothesis is an app that lets users annotate web pages (and PDFs, eBooks, videos, and more). The app is a sidebar that slides in over any web page and enables users to annotate the page and to see each other’s annotations:
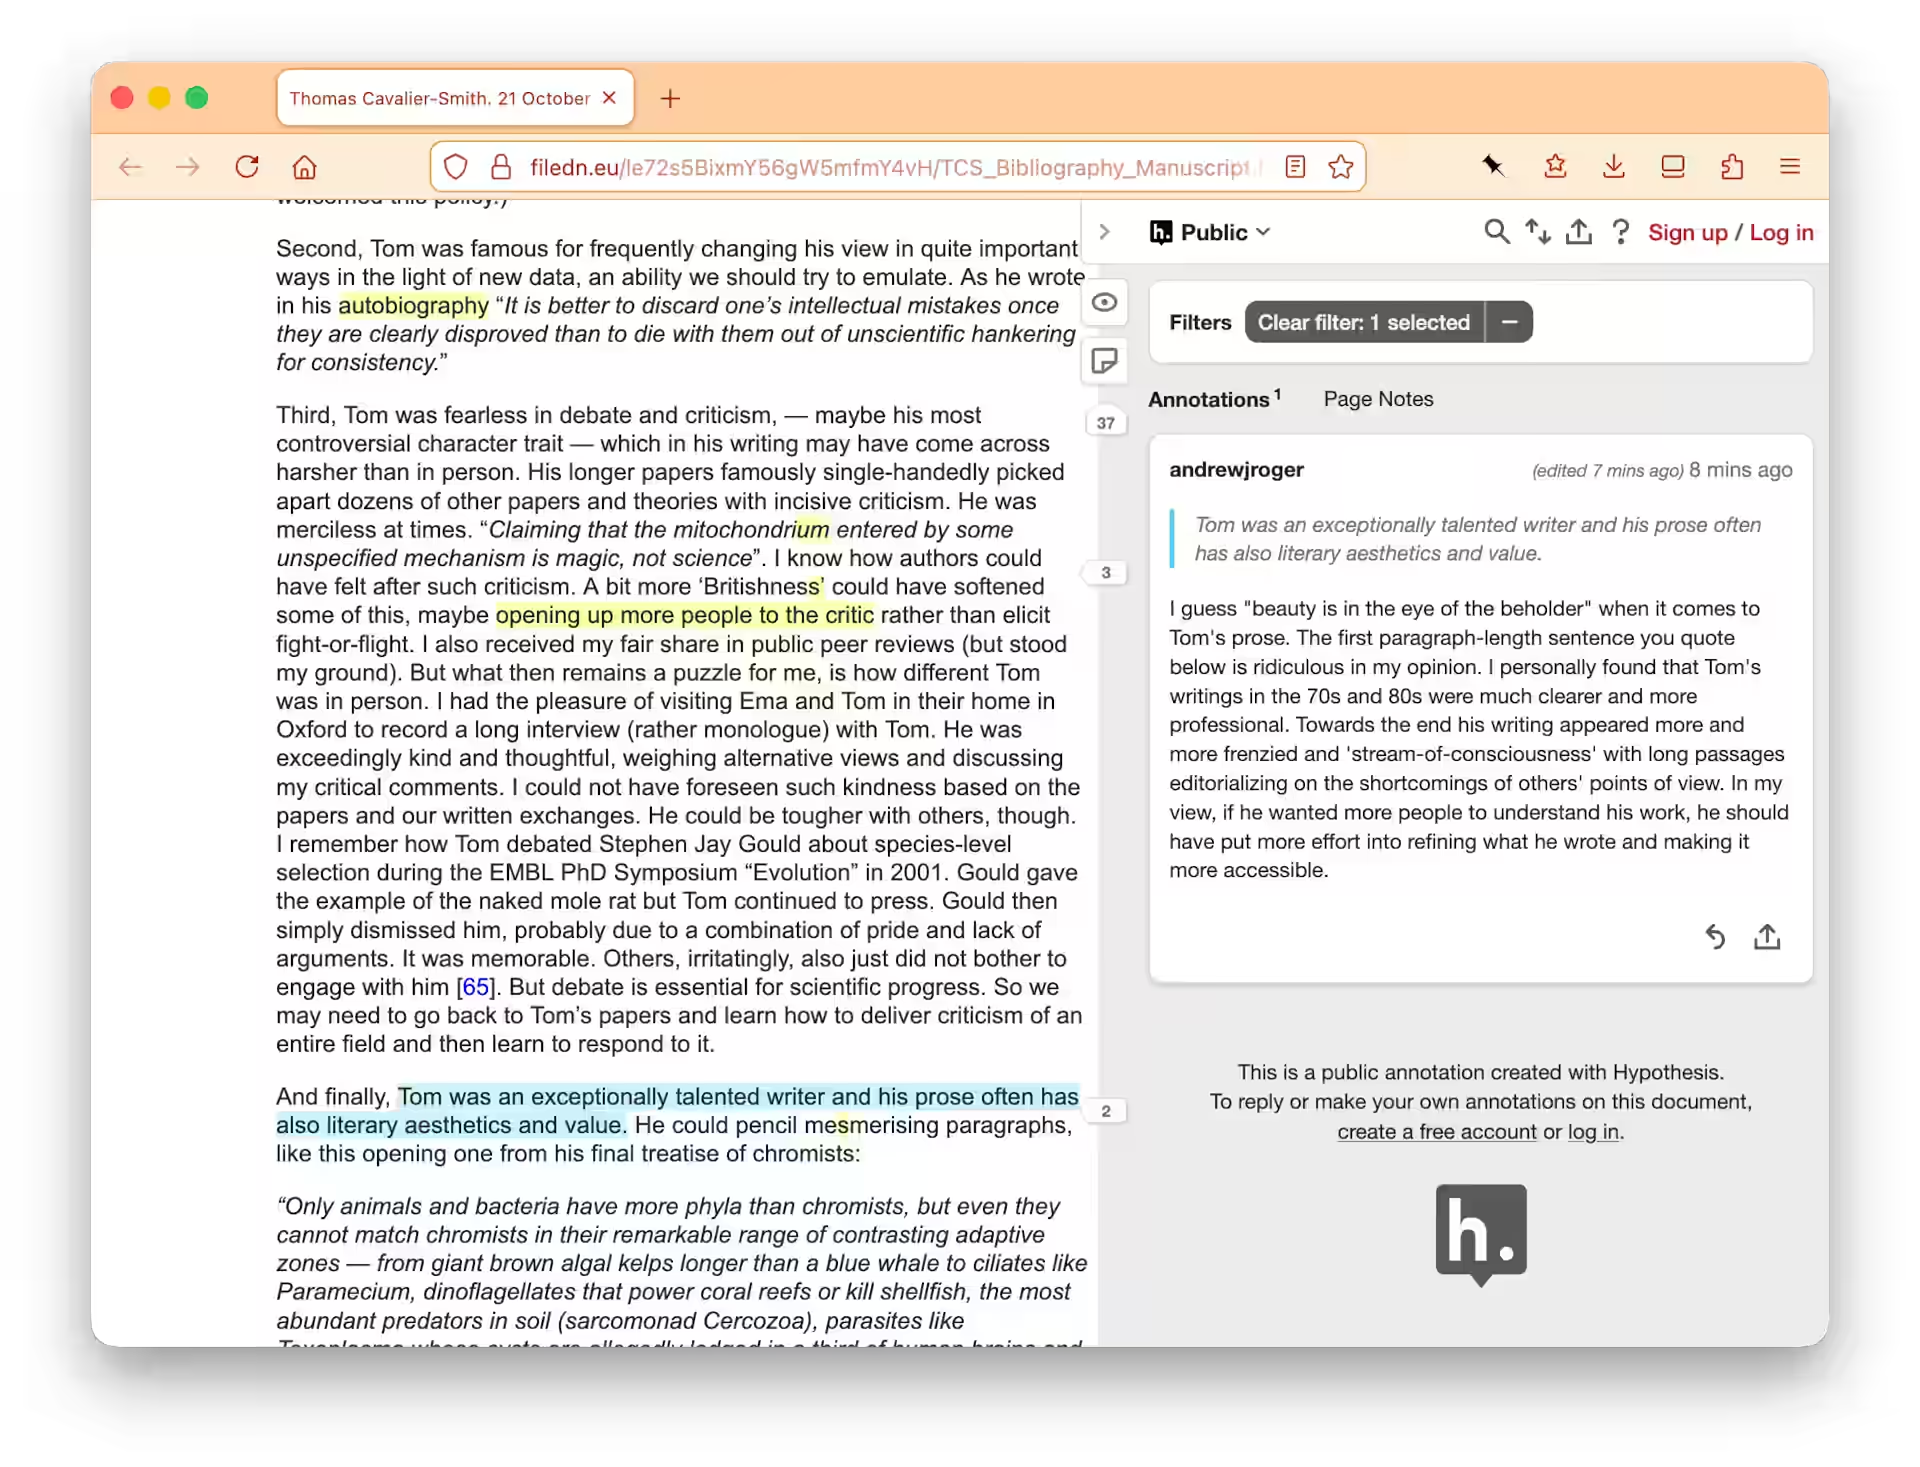
For this post all you need to know about Hypothesis is: the client (the sidebar app pictured above) sends API requests to the server: for example to fetch all the annotations for the page, or to create a new annotation on the page.
How Hypothesis fetches annotations
When the client launches over a page like in the screenshot above, this is how it fetches the page’s annotations:
GET /api/search?url=https://example.com/foo
It calls the search API??
Hypothesis calls the search API just to get the annotations for a URL!
This is for historical reasons:
in the primeval days of Hypothesis, its first architect chose
Elasticsearch as the only datastore, and /search was the only API
endpoint. Originally, everything went through the search API.
Yes, Hypothesis used Elasticsearch as its “database”!
This was a terrible idea for many reasons that I won’t go into here.
Good sense later prevailed: a Postgres DB was added and became the primary source of truth. But many functions—such as fetching the annotations of a page—were never moved off the search API.
Here’s how the server handles a /api/search request:
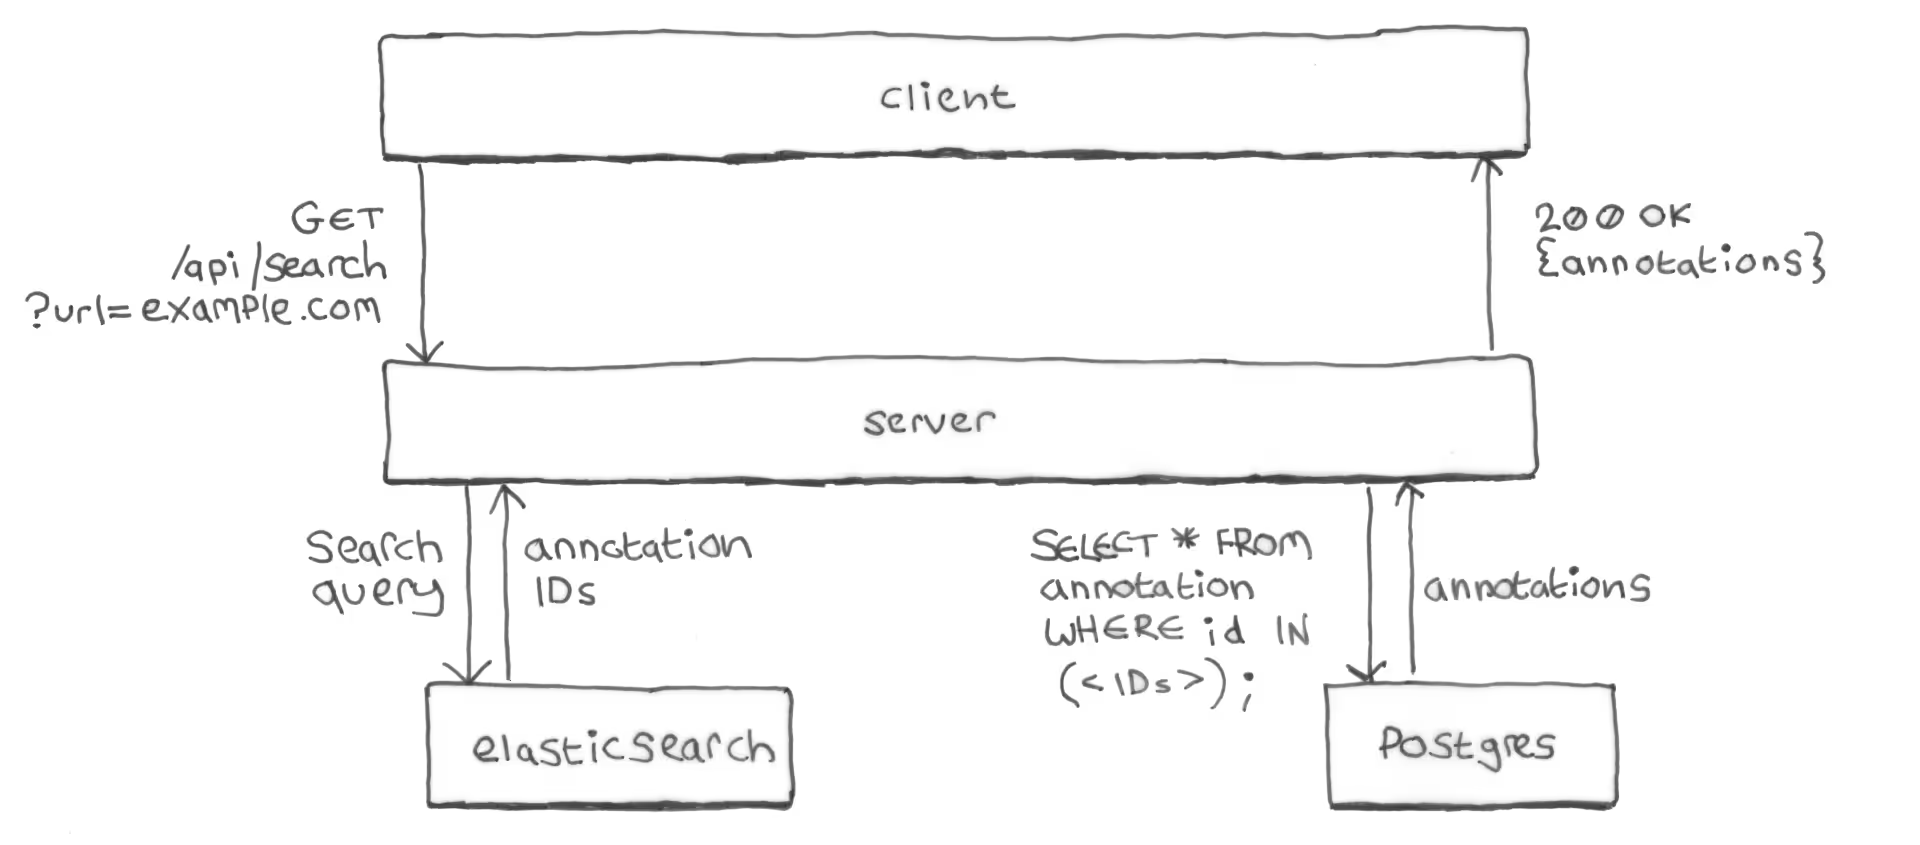
- The server queries Elasticsearch for the IDs of all annotations of the requested URL.
- The server queries Postgres: exchanging the annotation IDs from
Elasticsearch for the full annotation bodies from Postgres
(primary key query of the
annotationtable). - The server returns the annotations to the client as a list of JSON objects
in a
200 OKresponse.
Why not just return the annotations directly from Elasticsearch?
You might reasonably ask why the server doesn’t just retrieve the full annotation bodies from Elasticsearch in the first place, and use those to construct the API response? Why the additional query to Postgres?
Postgres is the source of truth for annotations, and Elasticsearch isn’t always up-to-date with what’s in Postgres. Elasticsearch’s copy of an annotation can—at least temporarily—be out-of-sync with Postgres’s copy: after the server has updated the copy in Postgres but before it’s managed to sync that update to Elasticsearch.
If a user edits an annotation and the new version has been written to Postgres but not (yet) to Elasticsearch, you don’t want the search API to still be returning the old annotation. Especially not when other (non-search) APIs are already returning the new version directly from Postgres.
Of course if an annotation’s contents are out-of-date in Elasticsearch then the search API may—at least temporarily—return that annotation for search queries that the annotation no longer matches. This was considered less bad than returning an outdated version of the annotation contents.
Missing from Elasticsearch == missing from the app
You might think that an annotation being missing from Elasticsearch would just mean that the annotation doesn’t show up in search results. As in: when the user types a query into a search box to try to find old annotations. A problem, but not the end of the world.
But (for historical reasons) Hypothesis over-uses its search API for many basic functions, and the search API works by querying Elasticsearch. If an annotation is missing from Elasticsearch it’ll be missing from search API responses and won’t be shown, for example, even when the client simply fetches the annotations for a page.
If an annotation is missing from Elasticsearch, it’s effectively missing from the app, as far as users are concerned.

How Hypothesis used to save annotations
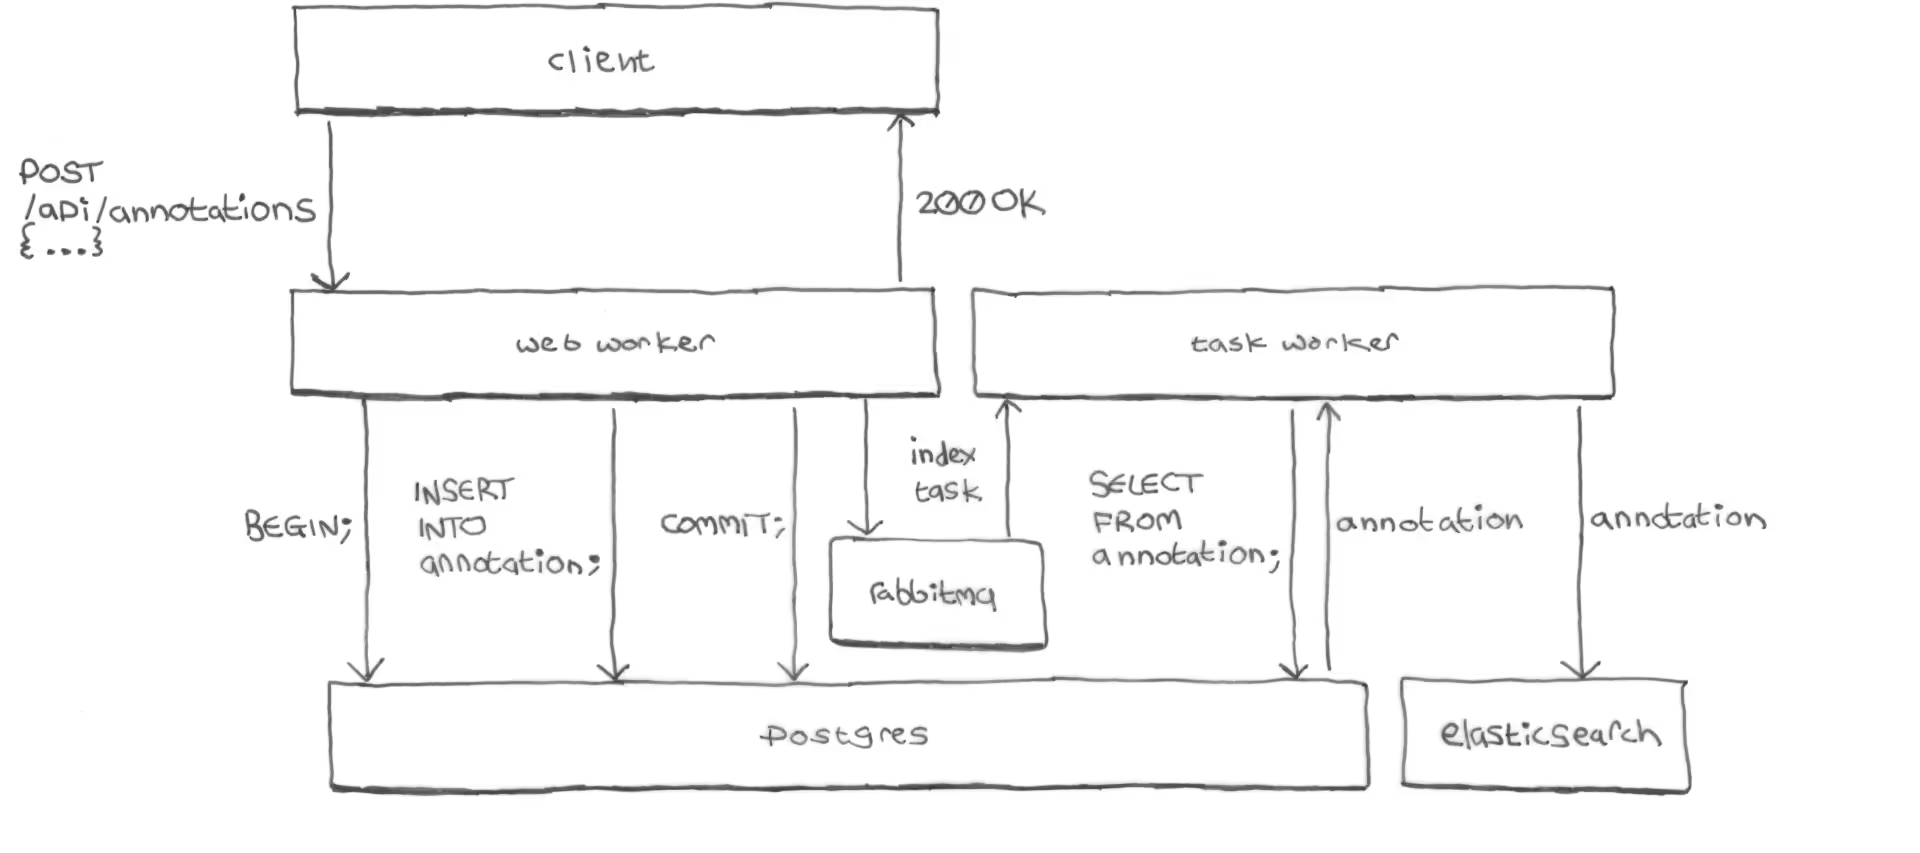
When a user wrote a new annotation and clicked the Post button:
-
The client sent a create-annotation API request to the server:
POST /api/annotations { <annotation_body> } -
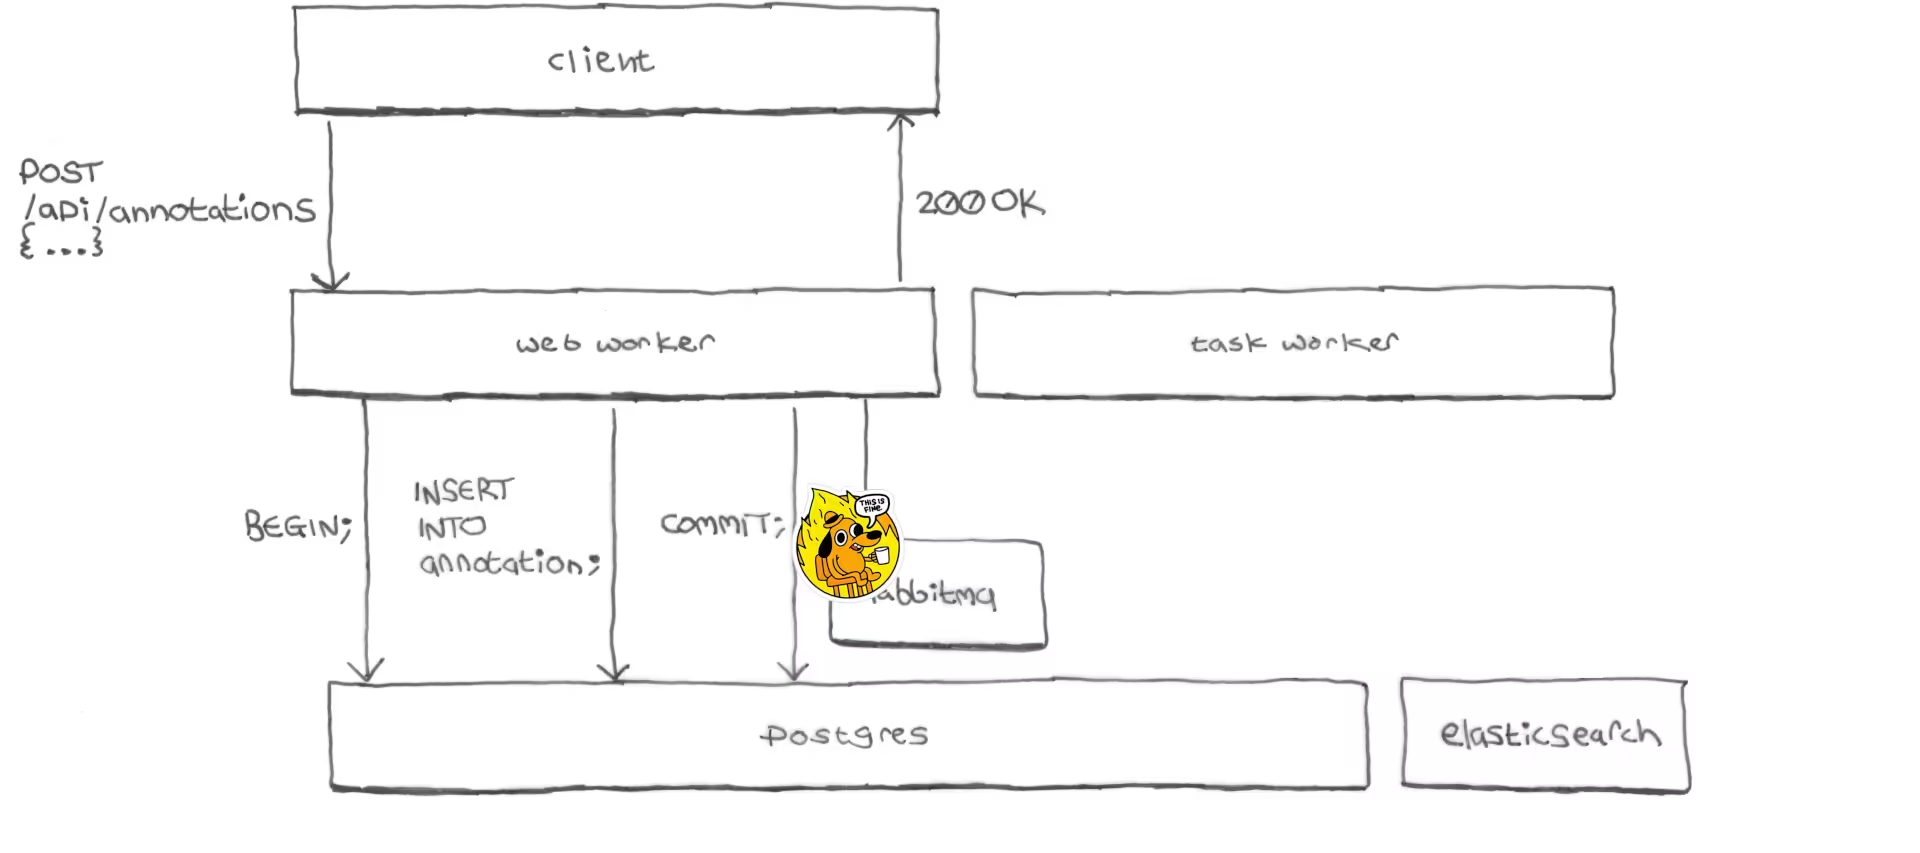
On the server, the web worker process that received the request wrote the annotation to Postgres and committed the transaction:
BEGIN; INSERT INTO annotation ...; COMMIT; -
The web worker added an
indextask to the task queue (RabbitMQ). -
The web worker returned a
200 OKresponse to the client. -
At this point the client had received the
200 OKresponse from the server and the interface had indicated to the user that the annotation was saved successfully.But so far the annotation had only been committed to Postgres, work continued in the background to index the annotation into Elasticsearch:
RabbitMQ delivered the
indextask to a background task worker process on the server. -
The task worker read the annotation back from Postgres again, and indexed the annotation into Elasticsearch. The task worker made only one attempt to do this. There were no retries.
The one thing I’ll say for this architecture is that it could never index an
annotation into Elasticsearch that hadn’t already been written to Postgres: the index task wasn’t sent to RabbitMQ unless the Postgres
transaction had already committed successfully. Unfortunately, as we’ll see,
the opposite was not true…
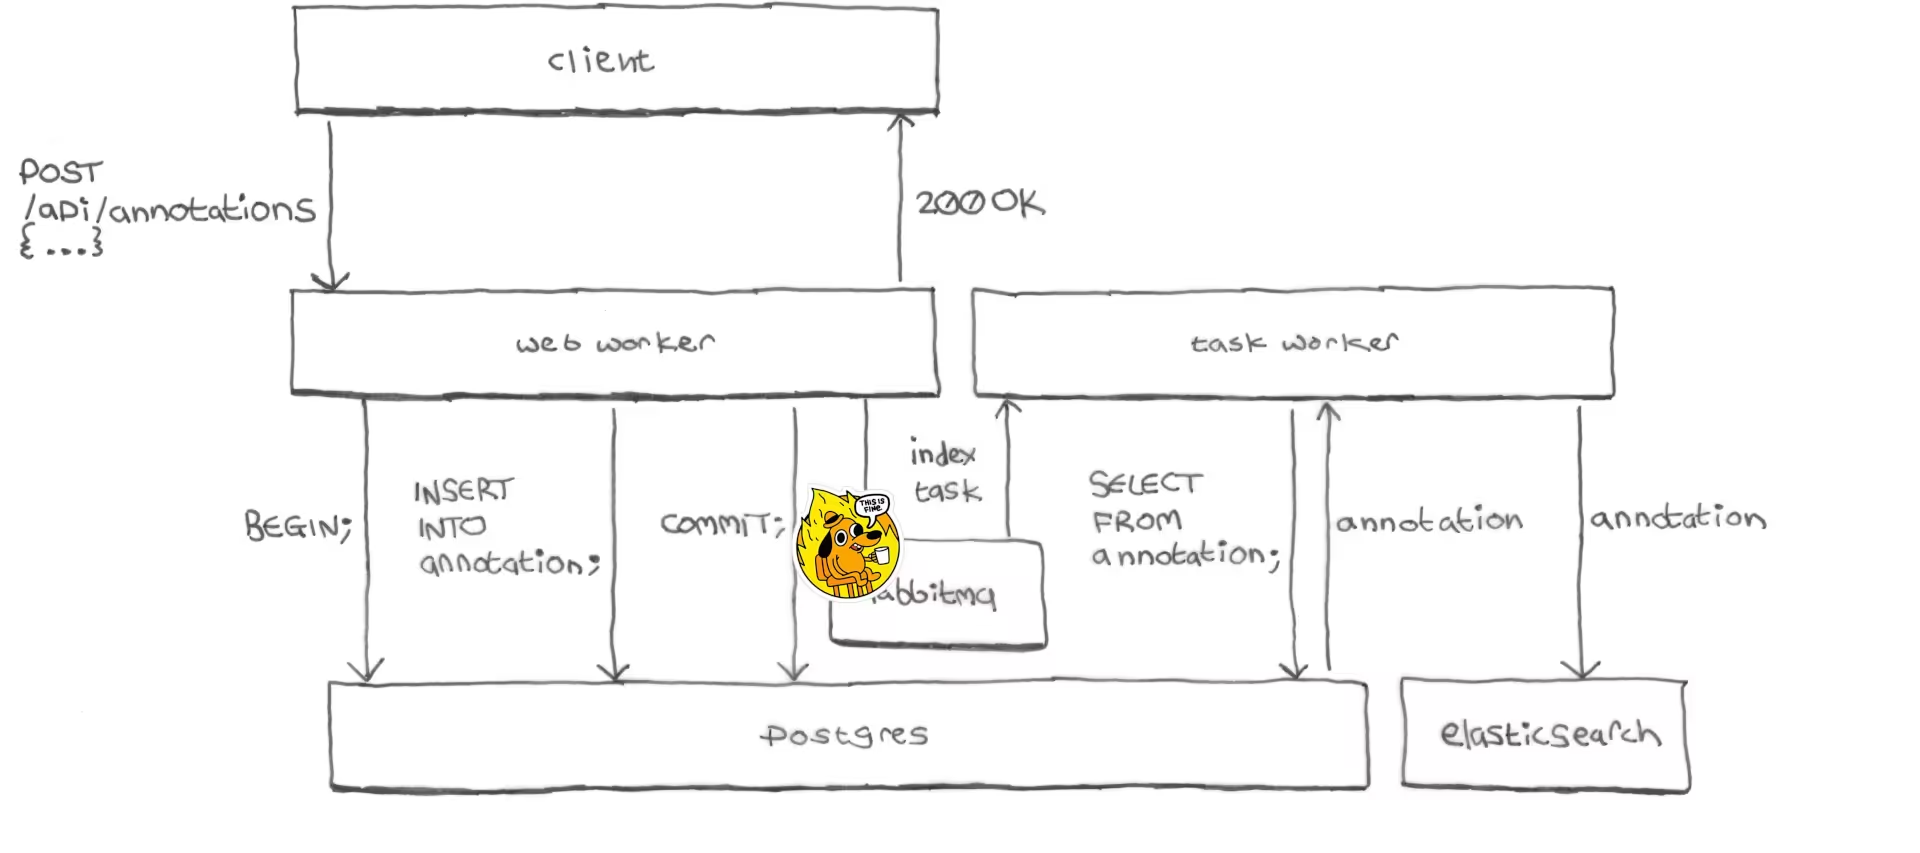
It worked, until it didn’t
This architecture worked just fine for years and engineering continued blissfully unaware. Until one day, out of nowhere, for no apparent reason, everything caught fire.

Any guesses?
We woke up one day to:
- All sorts of alarms firing
- Logs flooded with seemingly unrelated error messages: everything was failing
- CPU usage spiked and pinned to the ceiling
- General service degradation: requests across all endpoints slow, erroring, or timing out, but all of this only intermittently
- Users were sometimes seeing errors when trying to save annotations
- Some users reported annotations appearing to save successfully, but then disappearing from the app after a page reload
That last one was the crucial clue, but with all the other noise we dismissed it at first as user confusion. It could be reproduced, but only intermittently.
RabbitMQ was down
Our RabbitMQ provider had mis-configured our instance with less storage than we were actually paying for. It ran out of space and stopped responding.
Our web workers were blocking when trying en queue tasks: waiting for responses from RabbitMQ that weren’t coming. The worker would eventually give up waiting, but the timeout was set too high. Workers were waiting too long, causing slow response times not just for those requests that used RabbitMQ but for all other requests as well: they would be queued waiting for a worker process to become available, when all the workers were blocked waiting for RabbitMQ responses. Some requests were queuing for too long and getting timed out by the web server or client.
Also, our background task workers (which ran in the same containers as our web workers) were burning CPU trying to connect to RabbitMQ in tight retry loops.
It took two hours to restore service
I’ll defend the Hypothesis team’s record for responding to incidents: service would typically be restored to normal within minutes. But this time it took hours to diagnose the problem, for several reasons:
-
Recent loss of institutional knowledge.
The tech lead who architected the Elasticsearch indexing had recently left. This tech lead had a protégé developer who he worked closely with. This developer had also recently left. None of us remaining developers were primed to think of the task queue as the cause of general conflagration.
-
There were no alerts on RabbitMQ.
We were getting alerts about high error rates, slow response times, high CPU usage, etc. But nothing about RabbitMQ. Our RabbitMQ provider had built-in alerts for things like your instance’s storage being full, or your instance having stopped working. But it didn’t enable them by default, and no one had noticed.
-
The general-ness of the service degradation led us down dead ends: for example most of the failing requests we were seeing were for static files (because that was simply what the majority of requests were always for), so we spent time trying to figure out what had gone wrong with the system for serving static files.
-
The logs were flooded with errors, making them useless.
There were smoking gun error messages from our web workers timing out waiting for RabbitMQ responses, and from our task workers failing to connect to RabbitMQ. But they were lost in the flood. Everything was failing at everything.
Once we finally realized that RabbitMQ was down we contacted our provider who promptly apologized and rebooted the instance with more storage space, and our system quickly returned to normal service.
21.5K annotations were saved to Postgres but not to Elasticsearch
While writing up the incident report the following day I had a horrifying realization—thousands of annotations had been saved to Postgres but not to Elasticsearch:
After committing the annotation to Postgres the web worker’s request to
RabbitMQ would time out, and then the web worker would continue and send a
200 OK response to the client. No task was en queued, nothing was passed to
the task worker, the annotation was never sent to Elasticsearch.
Receiving a successful response, the client would indicate to the user that the annotation had been saved successfully.
Since fetching a page’s annotations requires them to be in Elasticsearch, the next time a user reloaded the page their annotation would be gone from the interface.
During the incident about 21,500 annotations had been saved to Postgres but not indexed into Elasticsearch: Elasticsearch had become badly out-of-sync with Postgres.
It took us a few days to recover the missing annotations by copying them from Postgres to Elasticsearch: we had no existing mechanism for re-indexing annotations that had already been saved to Postgres, and had to create one from scratch. You should always have a re-indexing mechanism!
It’s the Two Generals’ Problem!
Saving an annotation to both Postgres and Elasticsearch turns out to be an instance of the Two Generals’ Problem, a computer networking problem about coordinating action by communicating over an unreliable link:
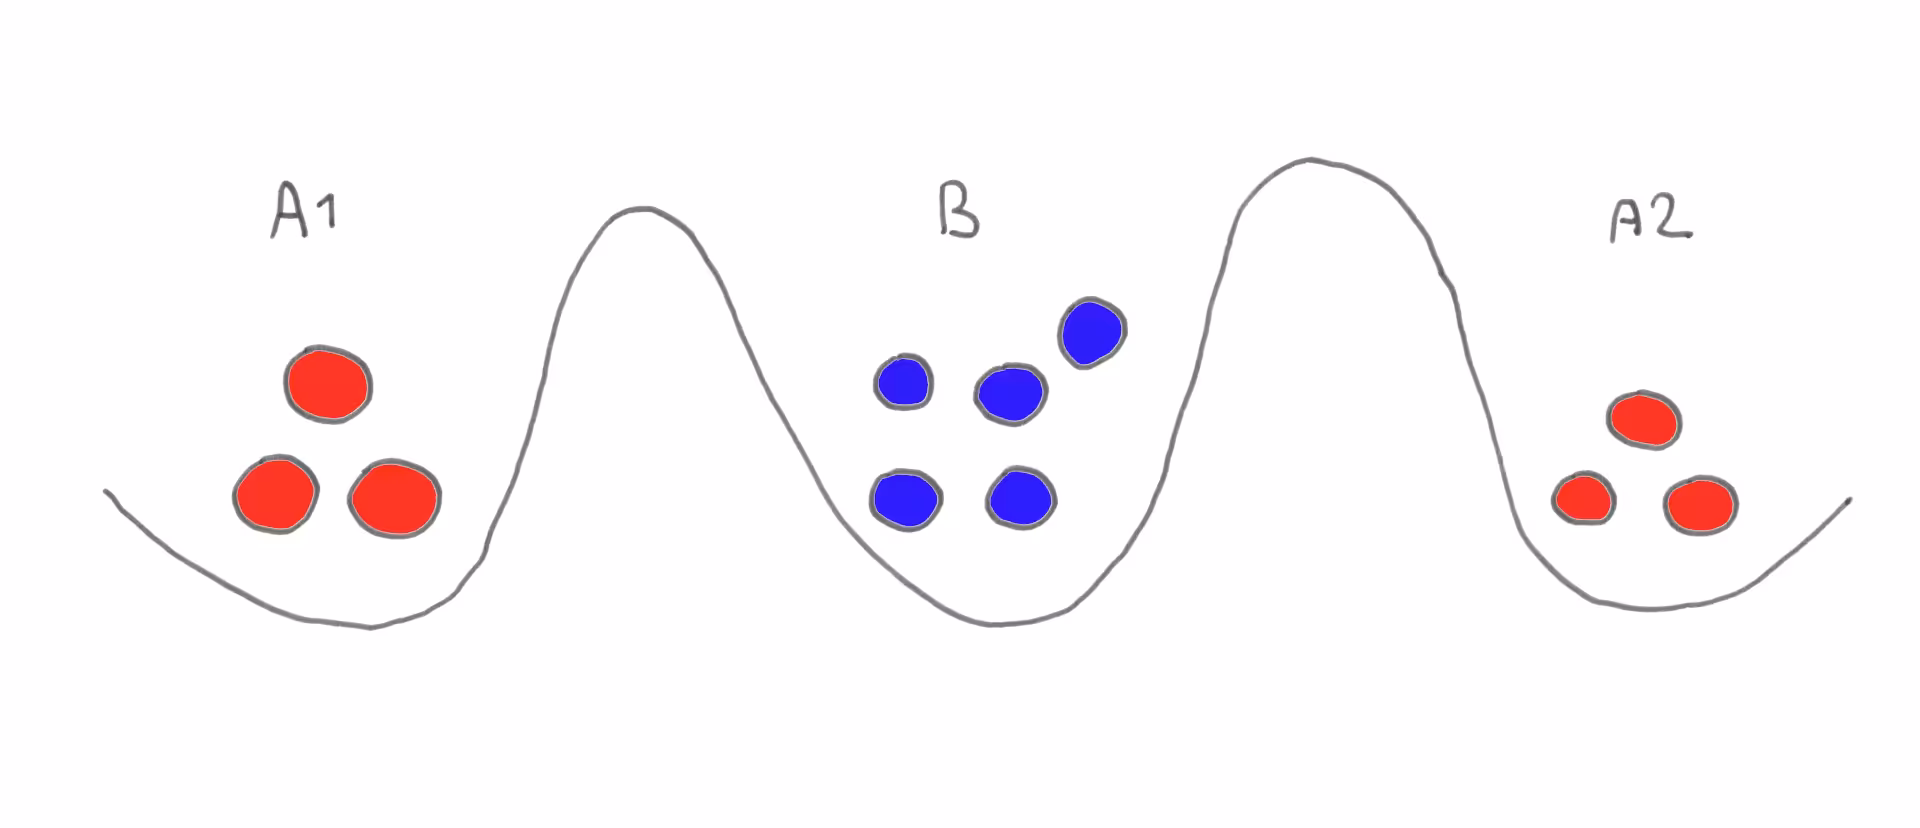
The Two Generals’ Problem: Armies A1 and A2 wish to attack larger army B, but will be destroyed if they attack separately. They need to both commit to attacking at the same time but can only communicate by sending messengers through the valley occupied by B, where any message or receipt might be intercepted.
You want to ensure that either the annotation is saved to both Postgres and Elasticsearch, or to neither, but never to only one and not the other.
You could commit the Postgres transaction before trying to index the annotation into Elasticsearch, as Hypothesis did, but as we saw: if indexing fails the annotation will be saved to Postgres but not to Elasticsearch.
Alternatively you could index the annotation into Elasticsearch and then try to commit the Postgres transaction, but then if committing fails the annotation will be in Elasticsearch but not in Postgres.
Unfortunately, the Two Generals’ Problem is provably unsolvable. Fortunately, we can re-architect things to work around it.
How we made sure it could never happen again
We created a job table in Postgres to hold the index
tasks, instead of sending them to RabbitMQ. Here’s how Hypothesis saves
annotations today:
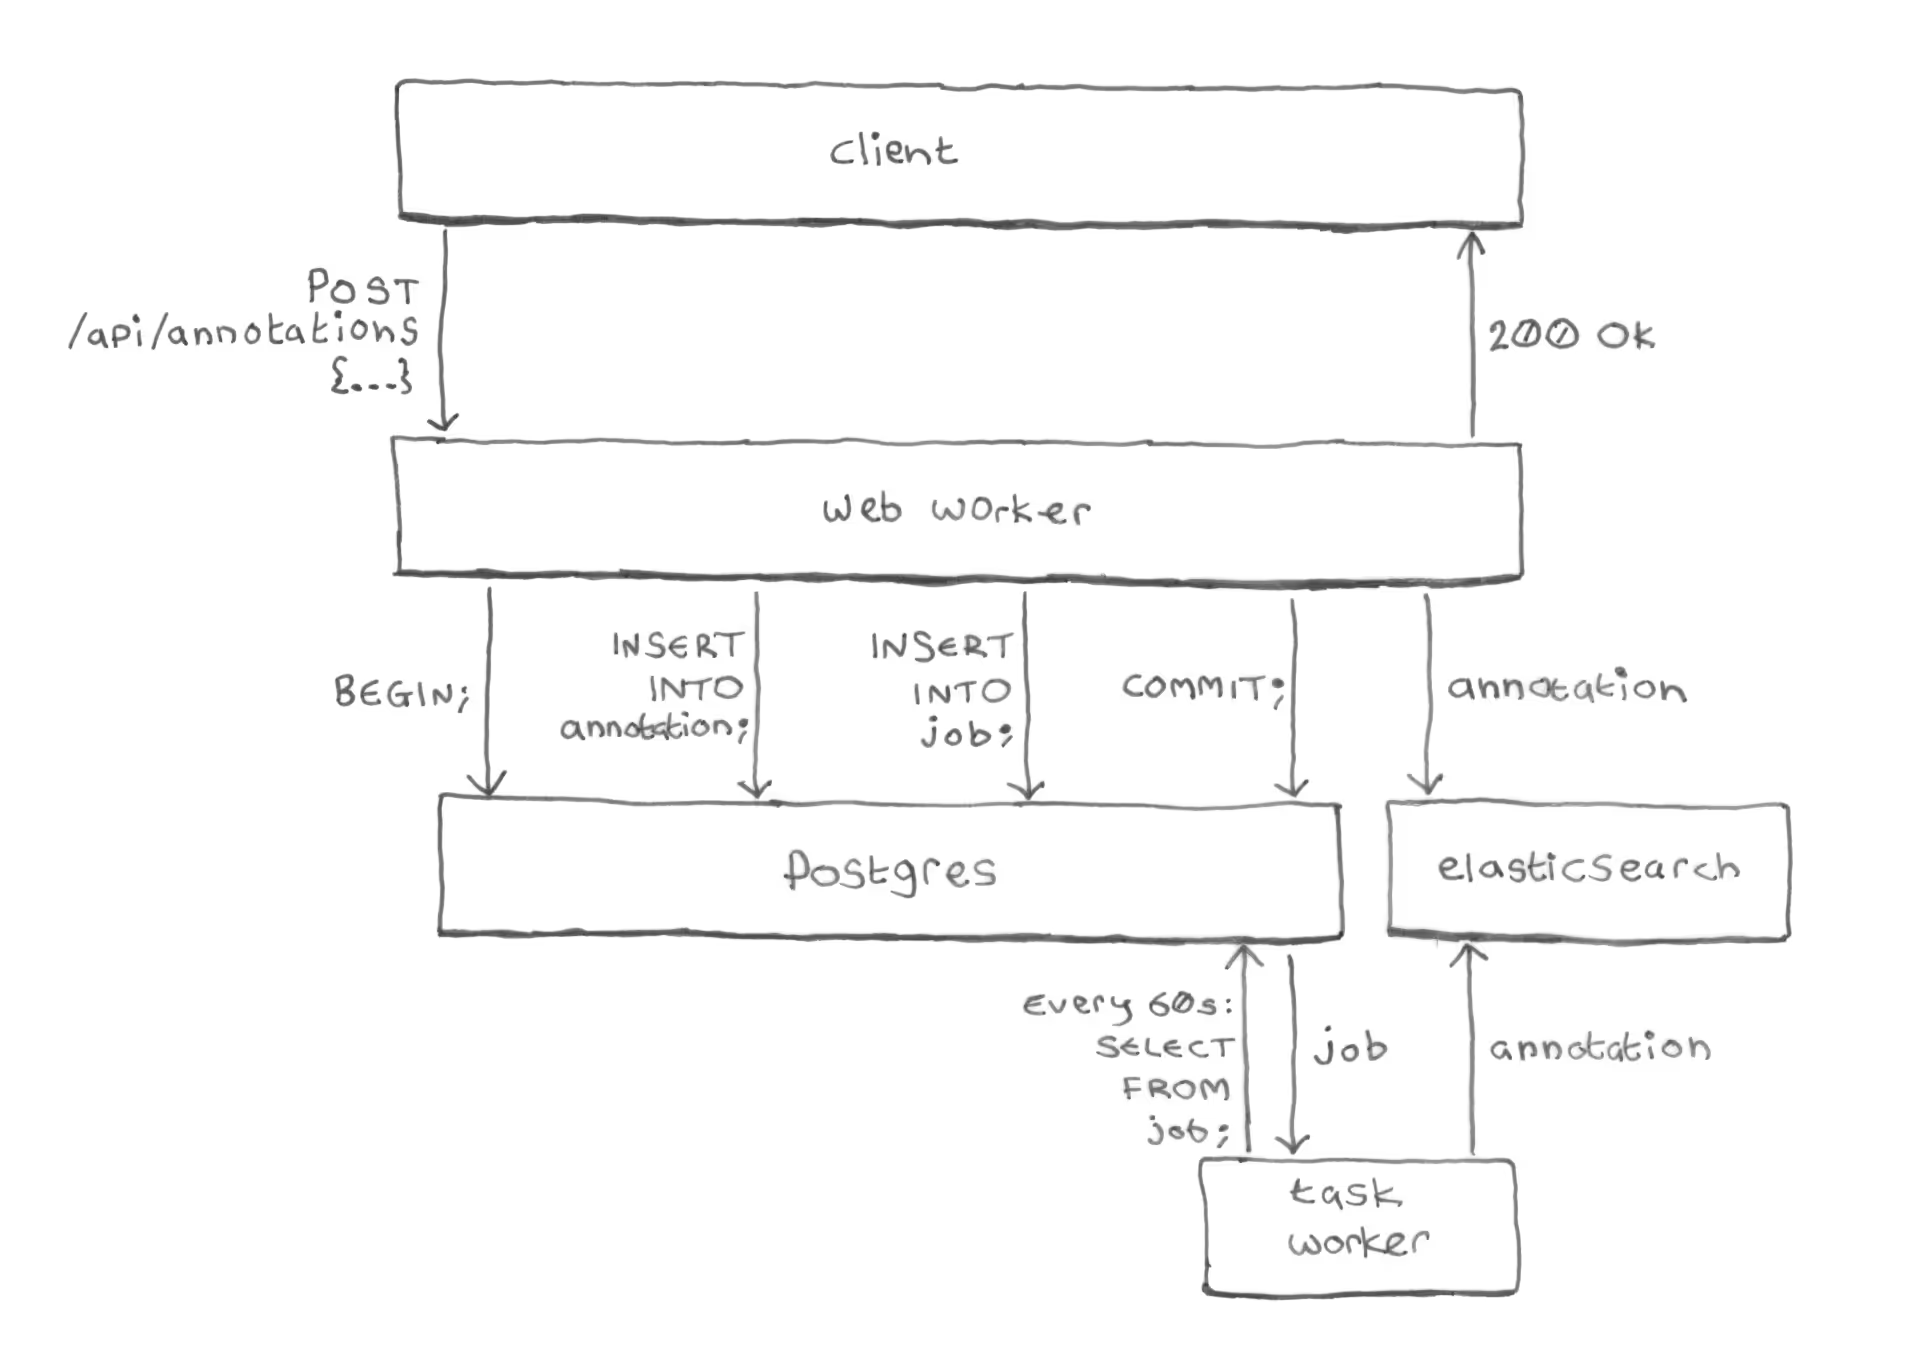
-
The web worker begins a Postgres transaction.
-
It inserts the annotation into the
annotationtable (as before). -
It also inserts an
indexjob for the annotation, into the newjobtable. -
It commits the Postgres transaction.
Crucially, we’re inserting the annotation and the job in a single Postgres transaction. Postgres makes transactions atomic: guaranteeing that either the annotation and job are both committed, or both are rolled back, never anything in-between.
-
Direct indexing: the web worker then directly indexes the annotation into Elasticsearch.
This is new: previously the web worker process never talked to Elasticsearch, that was done by a background task worker instead. Now, the web worker itself sends the annotation directly to Elasticsearch, no RabbitMQ.
-
Periodic indexing: after the web worker has finished processing the request and the client has received a
200 OKresponse, a periodic task (running every 60s) reads the job from thejobtable and double-checks that the annotation was successfully indexed. If the annotation is missing from Elasticsearch, the task re-indexes it.
Separation of concerns
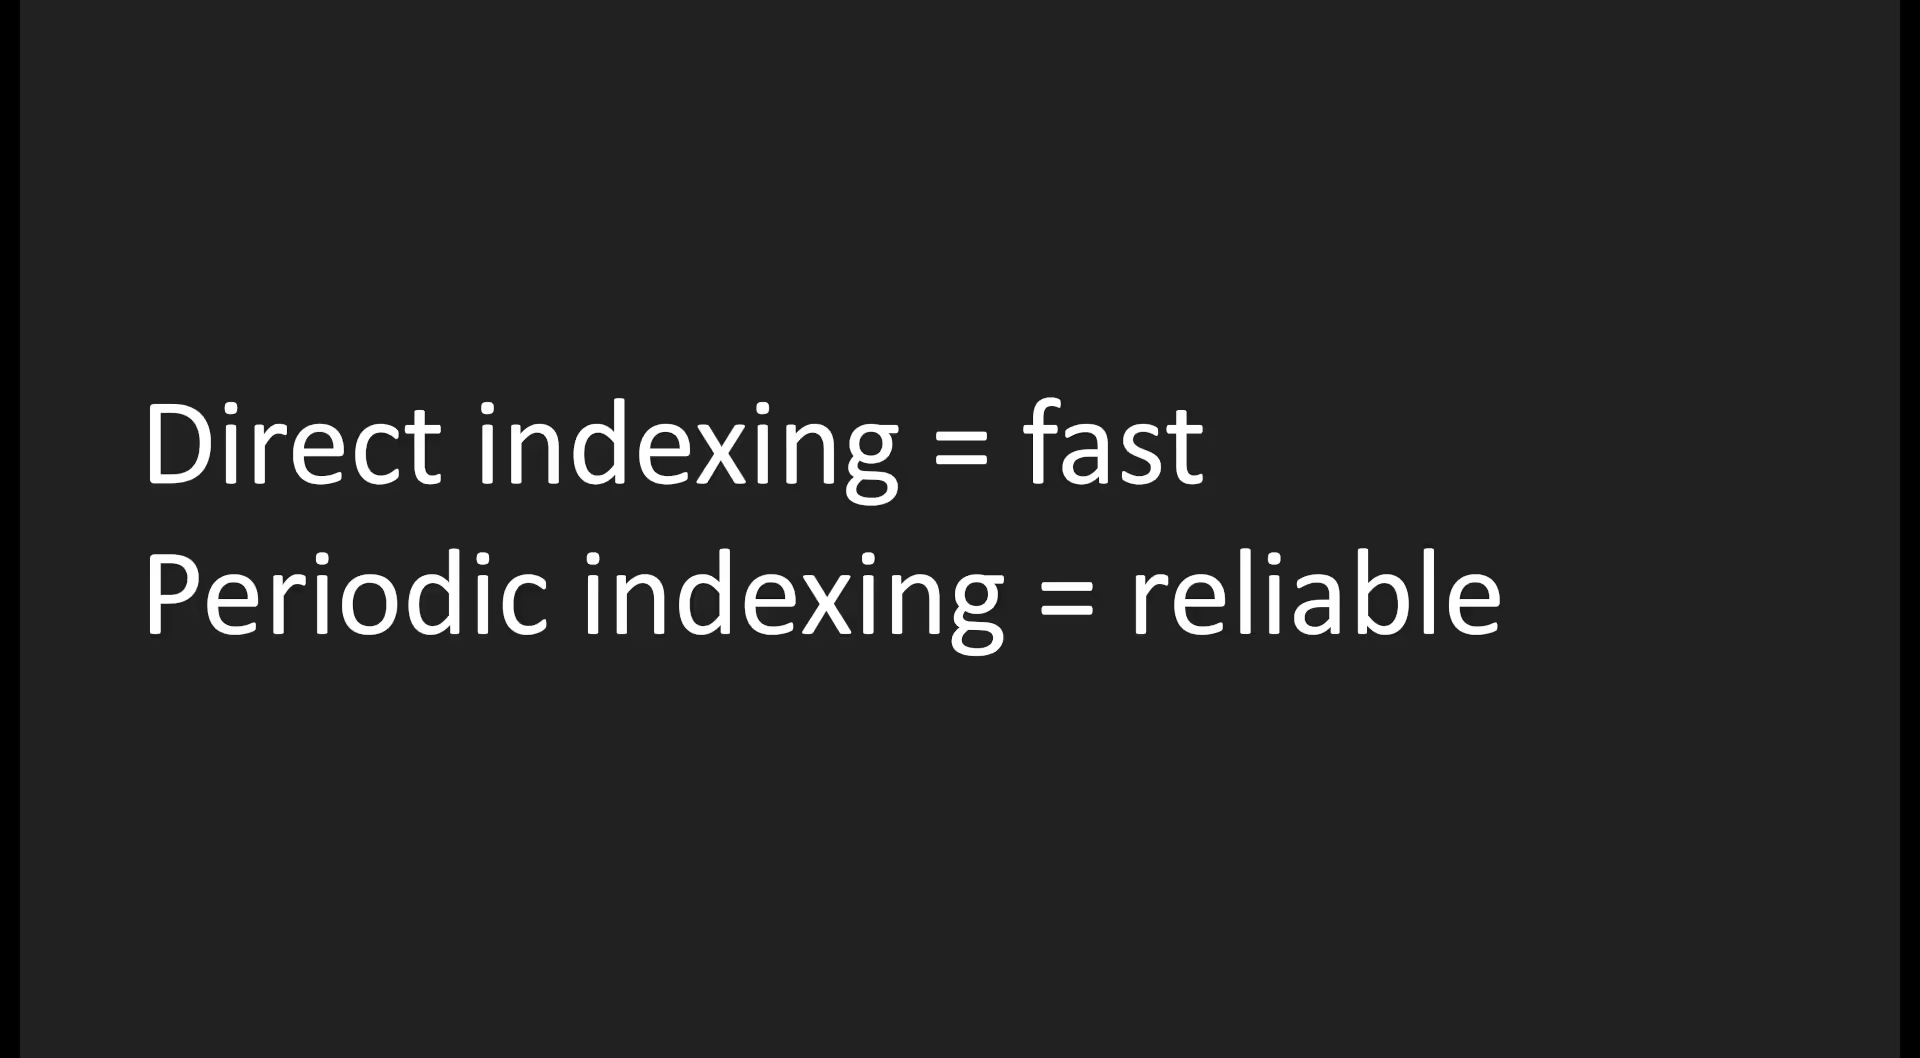
Direct indexing is fast
The direct indexing by the web worker (step 5 above) aims to be immediate: it indexes the annotation directly into Elasticsearch right after committing the Postgres transaction, before even responding to the client.
But direct indexing doesn’t have to worry about reliability (that’s handled by the periodic task, see below). In fact, the web worker deliberately compromises on reliability of Elasticsearch indexing in order to protect the reliability and response times of its own API responses to the client:
The web worker ignores errors from Elasticsearch:
if it gets an error response from Elasticsearch it just logs it and still
sends a successful 200 OK response back to the client. No retries.
The web worker also protects itself against slowness from Elasticsearch:
it sets a tight timeout on its requests to Elasticsearch, and if an
Elasticsearch request times out it just logs it and still sends a successful
200 OK response back to the client.
Even if there’s an extended Elasticsearch outage, the web worker will continue
writing annotations and jobs to Postgres, ignoring the errors from its
Elasticsearch requests, and sending prompt 200 OK‘s back to the client.
Periodic indexing is reliable
So the web worker is pretty nonchalant about whether its attempt to index the annotation into Elasticsearch actually worked or not. That’s why we also added periodic re-indexing by a background task (step 6 above).
Most likely the annotation will be successfully indexed by the web worker’s direct indexing. But it might not be: for example in case of an Elasticsearch outage, unreliability, one-off blip, a web worker process getting killed after the Postgres commit but before getting to the Elasticsearch indexing, etc. That’s when periodic indexing comes in.
The periodic task doesn’t have to worry about getting annotations into Elasticsearch quickly: that’s already been handled by direct indexing. Instead, the periodic task provides eventual consistency even in the face of unreliability and outages: if indexing an annotation fails it’ll retry many times and won’t remove the job from the queue until indexing succeeds.
It can even recover from extended Elasticsearch outages:
while Elasticsearch is down jobs will be piled up in the job table by the web
workers, and once Elasticsearch comes back online the periodic task will read
the jobs from the queue and index the missing annotations.
The transactional job table
Here’s what the job table looks like in SQL:
CREATE TABLE job (
  id INTEGER PRIMARY KEY GENERATED ALWAYS AS IDENTITY (CYCLE),
  name TEXT NOT NULL,
  enqueued_at TIMESTAMP WITHOUT TIME ZONE DEFAULT now() NOT NULL,
  scheduled_at TIMESTAMP WITHOUT TIME ZONE DEFAULT now() NOT NULL,
  expires_at TIMESTAMP WITHOUT TIME ZONE DEFAULT now() + interval '30 days' NOT NULL,
  priority INTEGER NOT NULL,
  tag TEXT NOT NULL,
  kwargs JSONB DEFAULT '{}'::jsonb NOT NULL
);
And here’s the SQL for adding a new job when an annotation is created:
INSERT INTO job (name, scheduled_at, priority, tag, kwargs)
VALUES (
  'index',
  now() + interval '60 seconds',
  1,
  'api.create_annotation',
  '{"annotation_id": 42}'
);
Some careful thought (and research into other task queue implementations)
went into deciding which columns to have and not have in the job table,
and making sure to pick the right types and defaults.
Here’s what each of the columns we ended up with is for:
id |
A unique ID for the job. Used when deleting jobs: you need to know the IDs of the jobs you just completed to tell Postgres which rows to delete.
Importantly for a column where rows are constantly being added
and deleted, the |
name |
The type of the job: for dispatching different types
of job to different handlers. This is always
|
enqueued_at |
When the job was added to the queue. Used for sorting: to process older jobs first. |
scheduled_at |
A job is only available for processing after its
This is used to avoid having a web worker and a task worker
attempt to index the same annotation at the same time:
as we’ve seen, the web worker commits the job to the
To avoid this collision, |
expires_at |
The time after which the job is no longer available for processing. If indexing an annotation is failing we can’t just let task workers keep retrying forever. Perhaps a bug or an invalid annotation body means that indexing this annotation can never succeed.
Once a job’s In practice, we never had a job expire. |
priority |
Used for sorting: to process higher-priority jobs before lower-priority ones.
We’ll see |
tag |
Used to separate jobs for analytics purposes
We used this to record which part of the system en queued the
job.
For example when an API request created a new annotation the
resulting job would be tagged
If we were seeing a spike in Tags also enabled us to fine-tune our job queue-based alerts (more on those later). |
kwargs |
A JSON object containing everything needed to complete the job.
For an
Notice that |
The sync_annotations task
sync_annotations() is the periodic task that runs every 60s,
reads jobs from the job queue,
and re-indexes any missing annotations.
Here’s the algorithm:
def sync_annotations():
    fetch up to 2500 rows from job table
    fetch the corresponding annotations from Postgres
                                 ...and from Elasticsearch
    for each job:
        if annotation not in Postgres:
            # The annotation has already been deleted from the
            # DB, so we don't need to write it to Elasticsearch.
            delete job
        else if annotation already in Elasticsearch:
            delete job
        else:
            write annotation to Elasticsearch
The crucial thing here is that annotations aren’t removed from the job queue until they’ve been successfully read back from Elasticsearch: if an annotation is found to be missing from Elasticsearch then the task indexes that annotation into Elasticsearch and doesn’t delete the job from the queue.
The next time the task runs (a minute later) it’ll get the same job from the queue again. This time it’ll (hopefully) find that the annotation is present in Elasticsearch, and delete the job.
We don’t trust that if we ask Elasticsearch to index an annotation and it
responds with 200 OK then the annotation will be indexed successfully. We
actually saw instances where Elasticsearch would respond 200 OK but the
annotation would not be indexed.
If the task finds that the annotation is still missing from Elasticsearch (meaning
its previous attempt to index the annotation must have failed) the task will
simply try to index the annotation again. It will keep trying to index the
annotation every minute until the annotation’s job in the job table expires.
Why 2500?
The sync_annotations task processes up to 2500
annotations at a time because that was the most that
Elasticsearch would accept in a single request to its bulk API.
Each time the task runs it reads up to 2500 jobs from the queue, reads the corresponding annotations from Postgres and from Elasticsearch, and if any of the batch of annotations turn out to be missing from Elasticsearch the task makes a single Elasticsearch bulk API request to index them, and then exits.
If there are more than 2500 annotations on the queue you just have to wait for the task to run multiple times to get through them all.
Fetching jobs
This is the query that the sync_annotations task uses to fetch the next 2500
jobs from the queue. Note that it filters out jobs that aren’t scheduled yet
and jobs that’ve expired, and it sorts by priority then en queued time:
SELECT     id, kwargs
FROM       job
WHERE      job.name = 'index'
AND        job.scheduled_at < now()
AND        job.expires_at > now()
ORDER BY   job.priority, job.enqueued_at
LIMIT      2500
FOR UPDATE SKIP LOCKED;
FOR UPDATE SKIP LOCKED
FOR UPDATE SKIP LOCKED prevents simultaneous task runs from fetching the
same jobs.
The task runs every 60s and was tuned so that it takes well under 60s to
complete. So in theory there should never be two sync_annotations tasks
running at the same time. In practice, I wouldn’t like to rely on that.
If a task run starts while one or more previous tasks are still running,
FOR UPDATE SKIP LOCKED skips over any jobs that’ve already been locked
and fetches the next 2500 instead.
FOR UPDATE SKIP LOCKED was designed specifically for implementing queues in
Postgres, there’s a
presentation about it from its creator.
Monitoring and alerts
If you’re going to rely on a queue, you have to monitor that queue. Otherwise you won’t know when it stops working.
We had our task worker report a bunch of custom metrics to New Relic: things like the current queue length, the number of jobs completed per minute, the number of expired jobs, etc, all groupable and filterable by job name/type, tag, and priority.
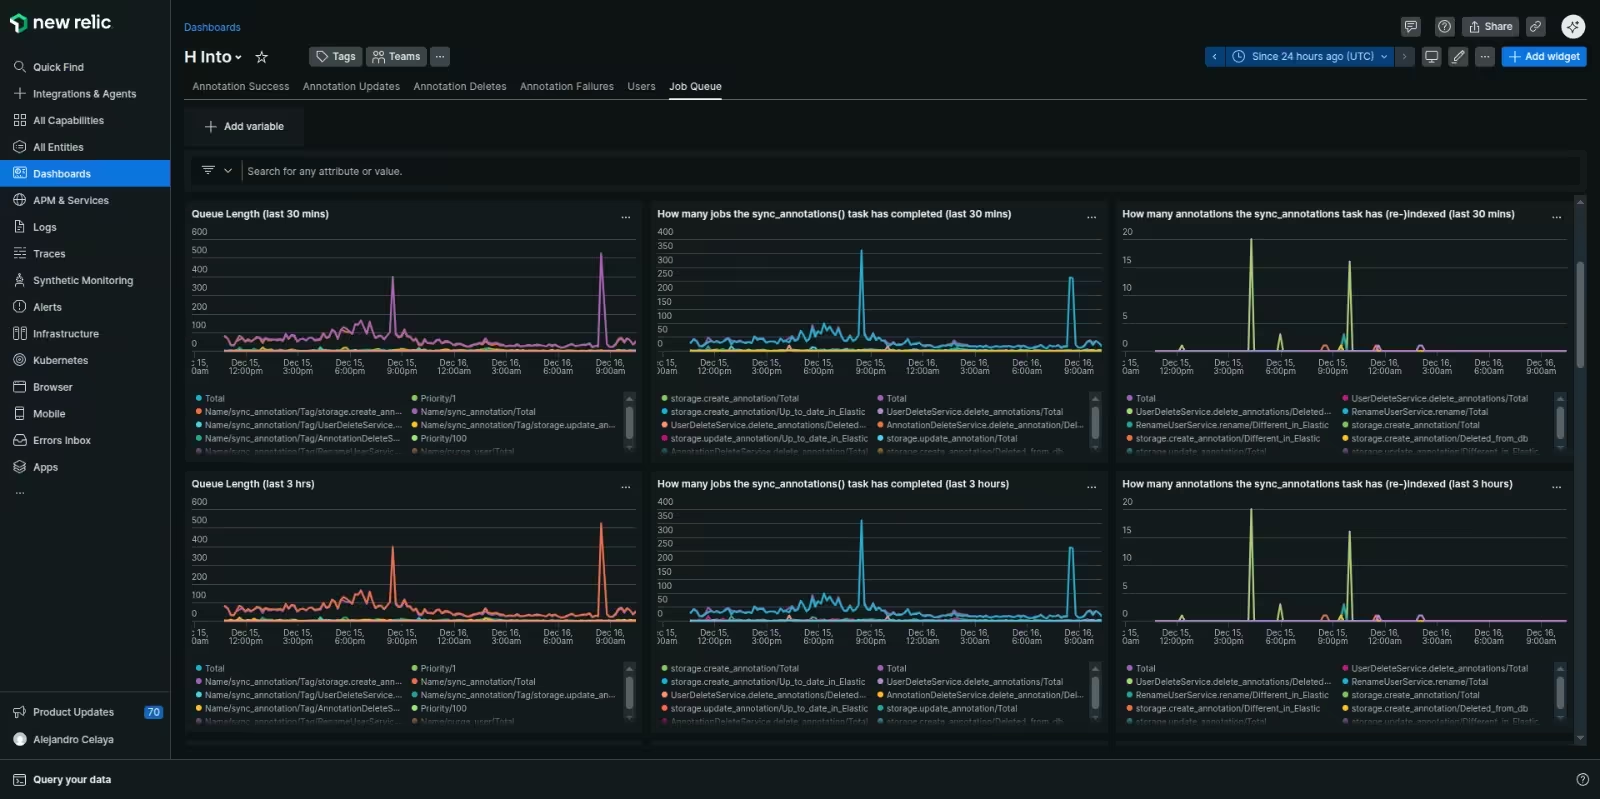
We could then craft alerts based on this data. We thought through all the different ways the system could fail and came with up three simple alerts to cover every possibility:
-
Job completion rate low-watermark alert.
Fires if the rate at which jobs are being successfully completed drops too low for too long. -
Queue length high-watermark alert.
Fires if the number of uncompleted jobs on the queue is too high for too long. -
Expired job(s) alert.
Fires if there are any expired jobs on the queue.
Here’s how these three alerts cover all the possible problem scenarios:
| Problem | Alert that fires |
|---|---|
| Producer stops: the system is no longer adding jobs to the queue when annotations get created. | Job completion rate low-watermark |
| Consumer stops the system is no longer completing jobs from the queue. | Job completion rate low-watermark |
| Consumer and producer both stop at once: alerts for high or low queue lengths wouldn’t trigger in this case. | Job completion rate low-watermark |
| Producer outpaces consumer: the system is adding jobs to the queue faster than it can complete them. | Queue length high-watermark |
| Stuck job(s): one or more jobs are getting stuck forever because indexing their annotations always fails. | Expired job(s) alert |
Re-indexing was now also possible
As a side-benefit we gained a simple way to re-index annotations by exercising
the same system that’s used to index annotations in the first place:
just add 'index' jobs to the job table and those annotations will get re-indexed.
We used this to give our admin users buttons for re-indexing all annotations from a given time period, user, group, or document. These buttons would set a low job priority to avoid interfering with the higher-priority indexing of new annotations if adding a lot of jobs at once. And they’d set different tags to avoid interfering with our metrics or triggering high-queue-length alerts.
The system also used the same technique when things like deleting, renaming, or hiding a user required all of that user’s annotations to be re-indexed.
The trick is to have an efficient way to select a potentially large number of
rows from the annotation table and add a job for each to the job table.
The most efficient technique we found was an
INSERT INTO ... SELECT ... FROM query.
With our hardware this was good enough to en queue tens of millions of
jobs in a single query:
-- Schedule re-indexing of all a given user's annotations.
INSERT INTO job (name, scheduled_at, priority, tag, kwargs)
SELECT
  'index',
  now(),
  100,
  'reindex_user',
  jsonb_build_object('annotation_id', annotation.id)
FROM annotation WHERE annotation.userid = :userid;
Alternative: transactionally staged job drain
I didn’t know about it at the time, but years later I came across an article by Brandur Leach about a technique he calls a transactionally staged job drain.
Brandur’s technique is very similar to the one described in this post but his
periodic background task is an enqueuer process that just removes jobs from the job table and adds them to RabbitMQ (or whatever task queue you’re using).
I like Brandur’s approach and would probably use it if I did this again. It means that the enqueuer’s performance is consistent regardless of what types of jobs are in the job drain: it’s always just reading rows from the job drain, adding them to the task queue, and deleting them from the job drain.
The actual task handling, which may vary significantly in performance and time required depending on the type of task, is all done by your task queue workers like any other task.
Alternative: just use Postgres full-text search
Postgres has full-text search, why not just use that and avoid the need for Elasticsearch entirely?
If I was building a new app today I’d see how long I could get away with Postgres full-text search (hopefully forever). Elasticsearch (or any separate search engine service) is expensive: in $ operating costs, in mental overhead for your team, and in architectural complexity (as this entire story demonstrates).
Hypothesis was already a heavy user of Elasticsearch, and exposed many Elasticsearch features more-or-less directly via its public search API. Re-architecting it to remove Elasticsearch was a big job, and there was always something more urgent to do.
Alternative: just use a Postgres task queue library
We implemented our own job queue in Postgres.
Why not just use an existing Postgres job queue library?
At the time none of the existing libraries for Python were mature or widely used. Our job queue didn’t need to worry about being fast and could just focus on eventual consistency, so we could keep it pretty simple. We continued using RabbitMQ for most tasks and our own transactional job queue only for tasks that needed transactionality and didn’t need immediacy.
If I did it again I’d take another look at Postgres-based job queue libraries for Python and see how far I could get with using one for all background tasks. Like Elasticsearch, RabbitMQ has its costs.